* Equal contributions.
Attribution methods can provide powerful insights into the reasons for a classifier’s decision.
We argue that a key desideratum of an explanation method is its robustness to input hyperparameters which are often randomly set or empirically tuned. High sensitivity to arbitrary hyperparameter choices does not only impede reproducibility but also questions the correctness of an explanation and impairs the trust of end-users. In this paper, we provide a thorough empirical study on the sensitivity of existing attribution methods. We found an alarming trend that many methods are highly sensitive to changes in their common hyperparameters e.g. even changing a random seed can yield a different explanation! Interestingly, such sensitivity is not reflected in the average explanation accuracy scores over the dataset as commonly reported in the literature. In addition, explanations generated for robust classifiers (i.e. which are trained to be invariant to pixel-wise perturbations) are surprisingly more robust than those generated for regular classifiers.
Conference: CVPR 2020. Oral presentation (acceptance rate: 335/6,656 = 5%).
Acknowledgment: This work is supported by the National Science Foundation under Grant No. 1850117.
Talks:
- 4-min Oral presentation at CVPR 2020.
- Presentation at 2D3D.ai
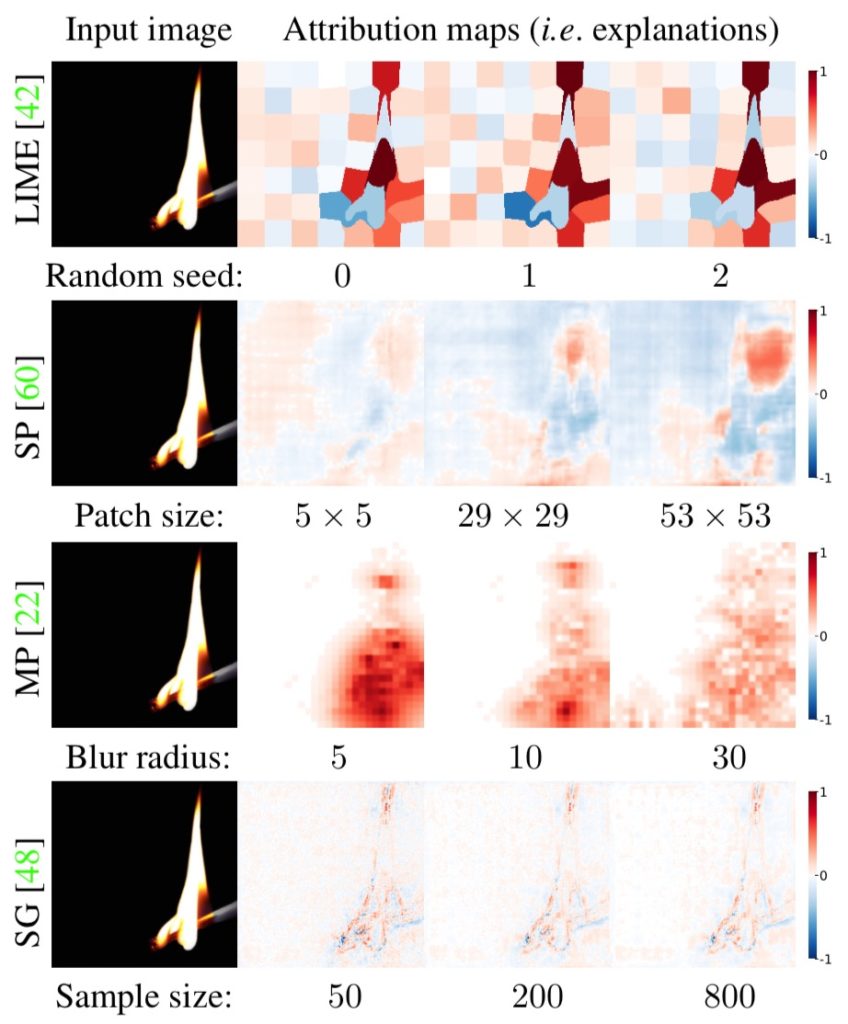
Figure 1: Attribution maps by four methods to explain the same prediction (match stick: 0.535) made by a ResNet-50 classifier to an ImageNet image. In each row, the explanations are generated by running the default settings of a method while varying only one common hyperparameter. All 12 explanations are unique and can be interpreted differently. LIME (Ribeiro et al. 2016): an explanation changes when one re-runs the algorithm with a different random seed. SP (Zeiler & Fergus, 2014): the positive evidence for the fire (top-right red blob) grows together with the patch size. MP (Fong & Vedaldi, 2017): attribution maps become more scattered as the Gaussian blur radius increases. SG (Smilkov et al. 2016): heatmaps becomes smoother as the number of samples increases.
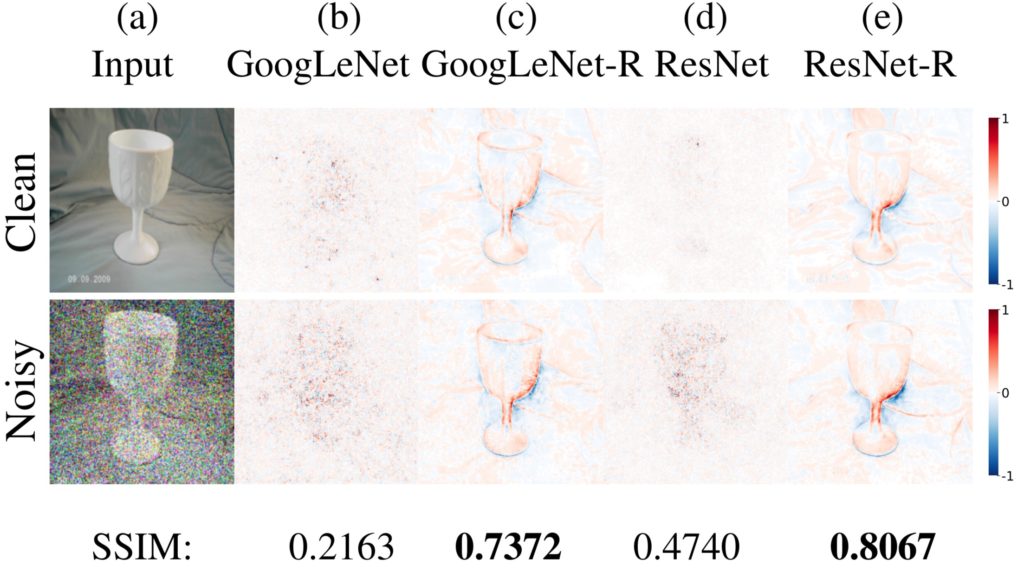
Figure 2: Top: The gradients of robust classifiers (c & e) reflect the structure of the goblet in an example input image (a), which is in stark contrast to the commonly reported noisy gradients of regular classifiers (b & d).
Bottom: The gradients of robust classifiers remain similar before and after the addition of noise to the input image (c & e—higher SSIM scores).
An SSIM similarity score is for the two images in each column.
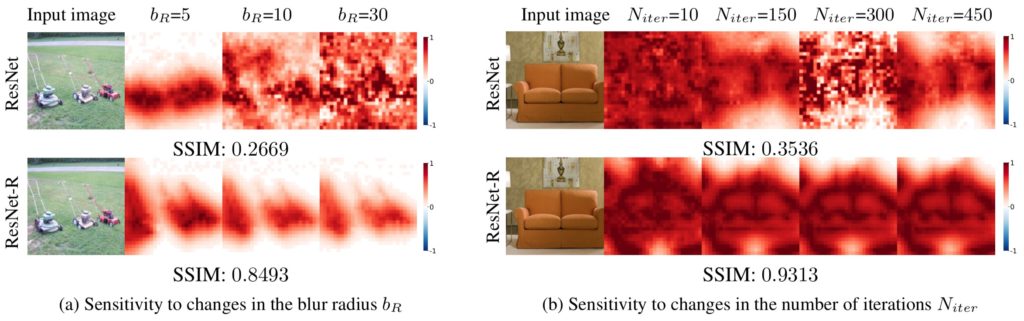
Figure 3: MP attribution maps generated for a regular model (ResNet) are highly sensitive to changes (i.e. low SSIM scores) in the Gaussian blur radius $b_R$ (a) and in the number of iterations $N_{iter}$ (b). In contrast, the same MP explanations for a robust model (ResNet-R) are substantially more stable
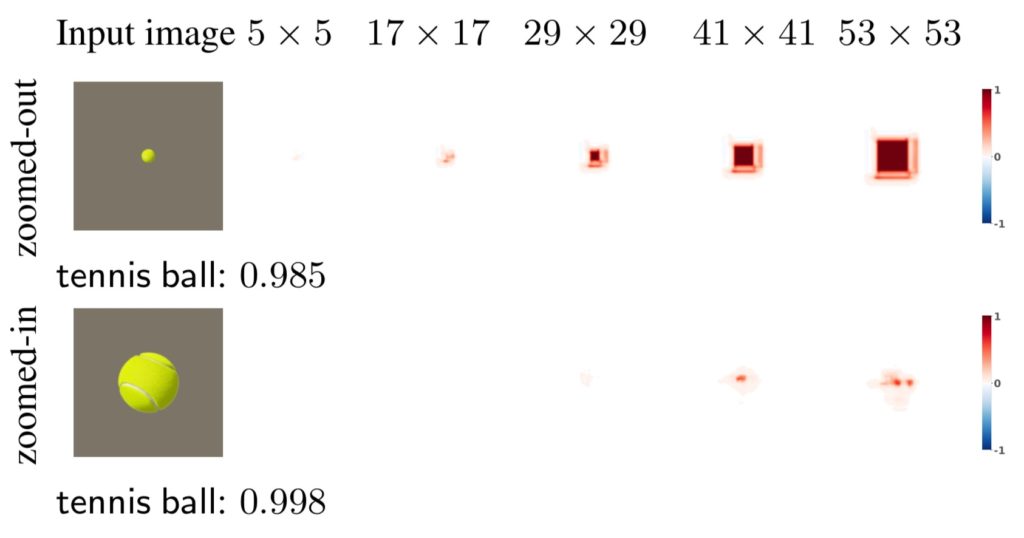
Figure 4: SP explanations are sensitive to patch sizes.
Zoomed-out: SP attribution region (red squares) for a tennis ball of size $19 \times 19$ (rendered on a $224 \times 224$ zero image) grows as the patch size increases.
Zoomed-in: SP outputs blank heatmaps at patch sizes of $5 \times 5$, $17 \times 17$, and $29 \times 29$, which are much smaller than the size of the tennis ball (here, $84\times84$) in a zoomed-in version of the top image.
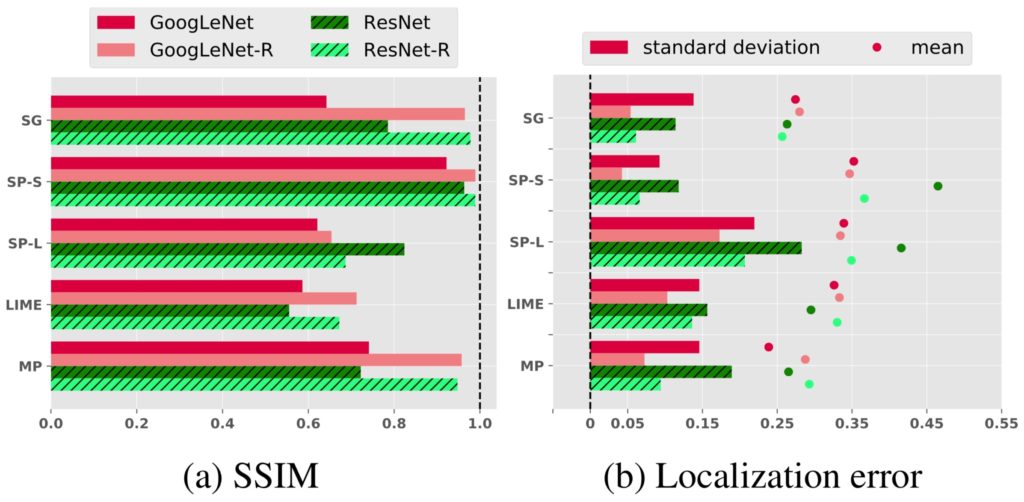
Figure 5: Average sensitivity of an individual attribution map measured in the pixel space (a) and three accuracy metric spaces: the Localization error (b), Deletion (c) and Insertion (d) scores (Sec. 4.5 in the paper).
The results were produced by varying the random seed of LIME and MP (bottom two rows), the patch size in SP (SP-S and SP-L), and the sample size of SG (top row).
Compared to regular models, robust models (here, GoogLeNet- and ResNet-R) cause the attribution maps to be more consistent pixel-wise under hyperparameter changes—i.e. higher SSIM scores (a)—and also more consistent in the three accuracy metrics—i.e. lower standard deviations (b–d).

