Interpretability methods often measure the contribution of an input feature to an image classifier’s decisions by heuristically removing it via e.g. blurring, adding noise, or graying out, which often produce unrealistic, out-of-samples. Instead, we propose to integrate a generative inpainter into three representative attribution methods to remove an input feature. Compared to the original counterparts, our methods (1) generate more plausible counterfactual samples under the true data generating process; (2) are more robust to hyperparameter settings; and (3) localize objects more accurately. Our findings were consistent across both ImageNet and Places365 datasets and two different pairs of classifiers and inpainters.
Conference: ACCV 2020 (acceptance rate: 255/768 = ~33%).
Acknowledgment: This work is supported by the National Science Foundation under Grant No. 1850117.
Talks:
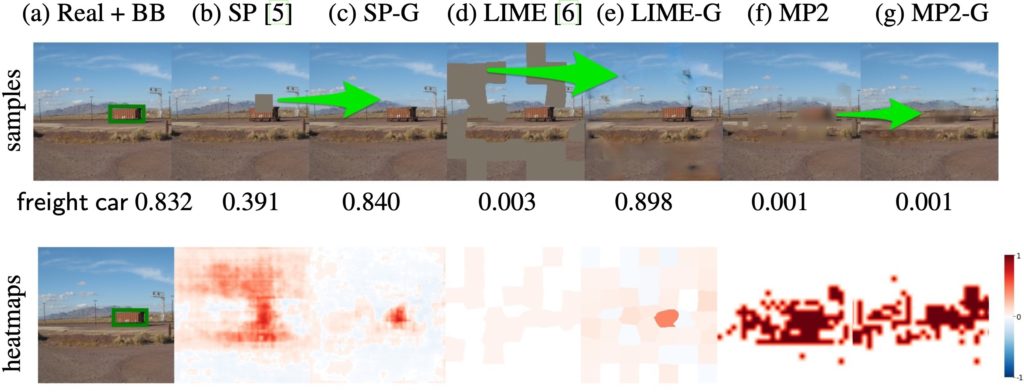
Figure 1: Three attribution methods, SP, LIME, and MP, often produce unrealistic, out-of-distribution perturbation samples.
Top row: SP slides a 29 x 29 gray patch across the image (b). LIME grays out a set of random superpixels (d). MP blurs out almost the entire image (f). In contrast, a learned inpainter integrated into these methods produces realistic samples for the same perturbation masks, here, completing the freight car (c), completing the background (e), and removing the car from the scene (g).
Note that the freight car class probability is reduced by 57% (i.e. from 0.929 to 0.391) when only the top of the car is occluded (b). However, it is reduced by ~100% down to 0.003 when the car is still present but the background is unnaturally masked out (d). Since the inpainted samples are more realistic, the probability drops are often less (c & e) and substantial only when the object is removed completely (g).
Bottom row: the inpainted samples yield heatmaps that outperform the original methods on the object localization task.
Here, our heatmaps (SP-G, LIME-G, and MP-G) are less noisy and more focused on the object.
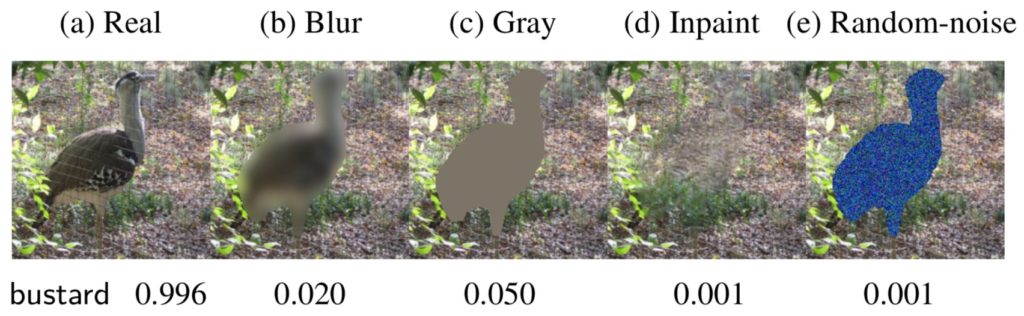
Figure 2: The results of filling the object mask in the real image (a) via four different filling methods. The shape of the bird is still visible even after blurring (b), graying out (c) or adding noise (e) to the bird region. The inpainter removes the bird and fills in with some realistic background content (d). Here, the bustard bird class probability for the inpainted image (d) is at random chance (0.001) suggesting that the Inception-v3 classifier does not detect any remaining bustard features.
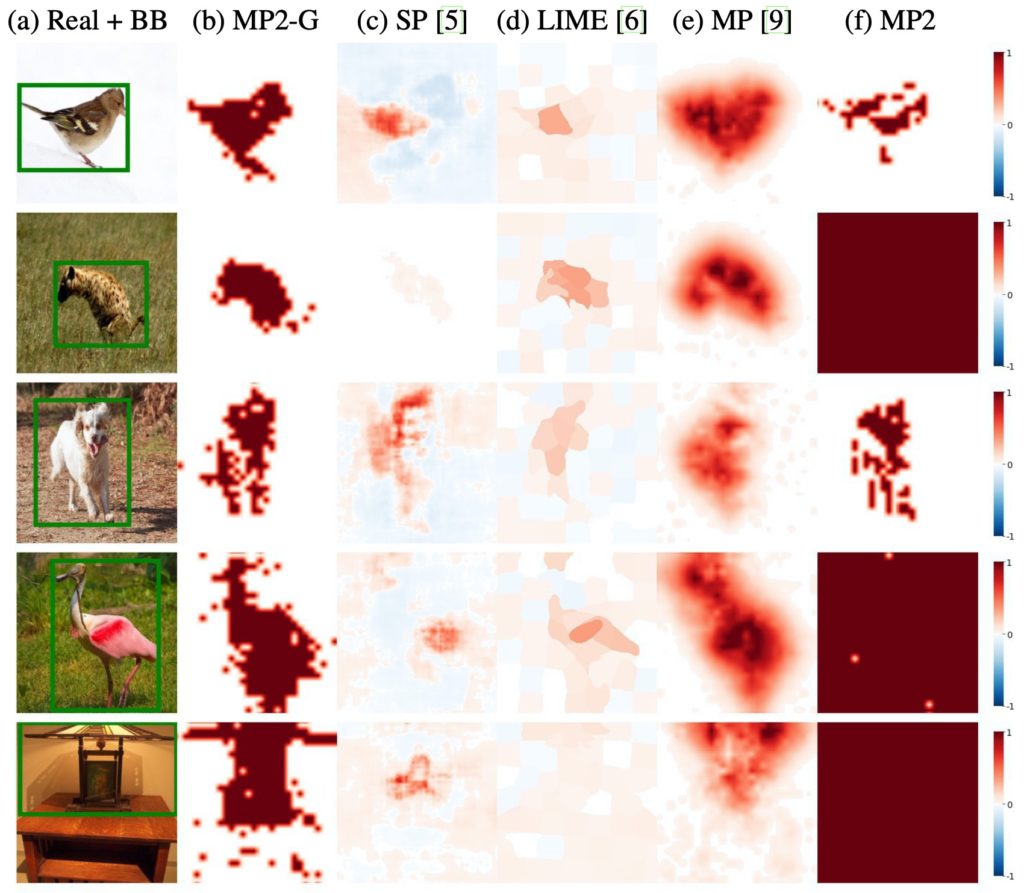
Figure 3: MP2-G results in attribution maps that localize the objects accurately compared to other perturbation-based methods. From left to right, in each row, we show a real ImageNet image with its ground-truth bounding box (BB) (a), attribution maps from the proposed MP2-G (b) and other existing methods (c–f). Images are randomly chosen
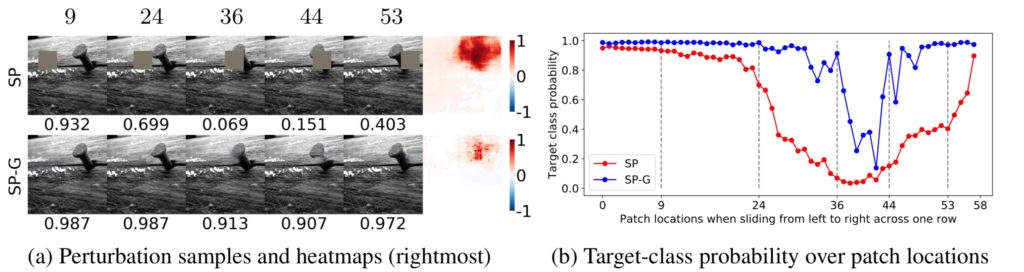
Figure 4: We ran SP and SP-G using a 53 x 53 patch on a nail class image. Here are the perturbation samples derived for both methods when the patch is slided horizontally across one row at 5 locations {9, 24, 36, 44, 53} (a); and their respective target-class probability scores (b). SP-G samples are more realistic than those by SP and yielded a heatmap that localizes the object more accurately (a). That is, the probabilities for SP-G samples are more stable and only substantially drop when the patch covers the object (blue vs. red).
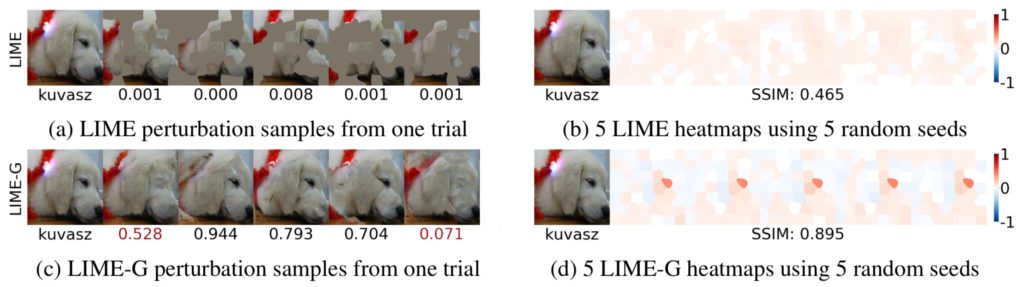
Figure 5: This is an example where LIME-G heatmaps are more consistent than LIME’s (d vs. b) across 5 different random seeds. While LIME grayish samples (a) are given near-zero probabilities, LIME-G samples (here, inpainted using the same masks as those in the top row) are often given high probabilities except when the kuvasz dog’s eye is removed (c). LIME-G consistently assign attributions to the dog’s eye (d) while LIME heatmaps appear random (b).
The top-1 predicted labels for 4 out of 5 LIME samples (a) here are paper towel.
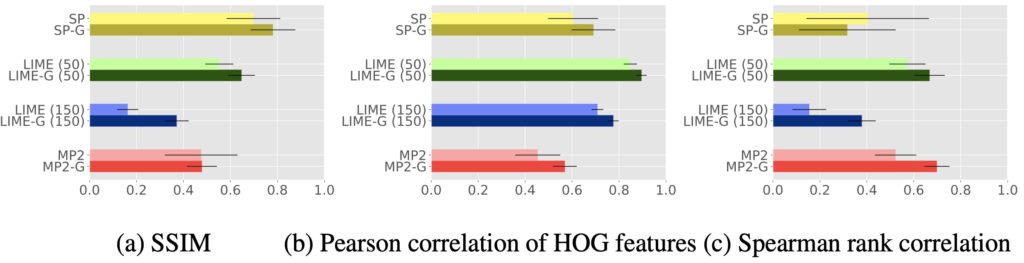
Figure 6: Error plots for SSIM (a), Pearson correlation of HOG features (b), and Spearman rank correlation (c) scores obtained from 1000 random ImageNet-S images (higher is better). LIME-G is consistently more robust than LIME on both low and high resolutions i.e. S in { 50, 150 } (green and blue bars). The same trends were also observed on the Places365-S dataset


