Image classifiers are information-discarding machines, by design. Yet, how these models discard information remains mysterious. We hypothesize that one way for image classifiers to reach high accuracy is to first zoom to the most discriminative region in the image and then extract features from there to predict image labels, discarding the rest of the image. Studying six popular networks ranging from AlexNet to CLIP, we find that proper framing of the input image can lead to the correct classification of 98.91% of ImageNet images. Furthermore, we uncover positional biases in various datasets, especially a strong center bias in two popular datasets: ImageNet-A and ObjectNet. Finally, leveraging our insights into the potential of zooming, we propose a test-time augmentation (TTA) technique that improves classification accuracy by forcing models to explicitly perform zoom-in operations before making predictions. Our method is more interpretable, accurate, and faster than MEMO, a state-of-the-art (SOTA) TTA method. We introduce ImageNet-Hard, a new benchmark that challenges SOTA classifiers including large vision-language models even when optimal zooming is allowed.
Acknowledgment: This work is supported by the National Science Foundation under Grant No. 2145767, Adobe Research, and donations from the NaphCare Foundation.
Conference: NeurIPS 2023 Dataset and Benchmark Track (acceptance rate: 322/987 = ∼32.7%).
Download: ImageNet-Hard dataset on HuggingFace
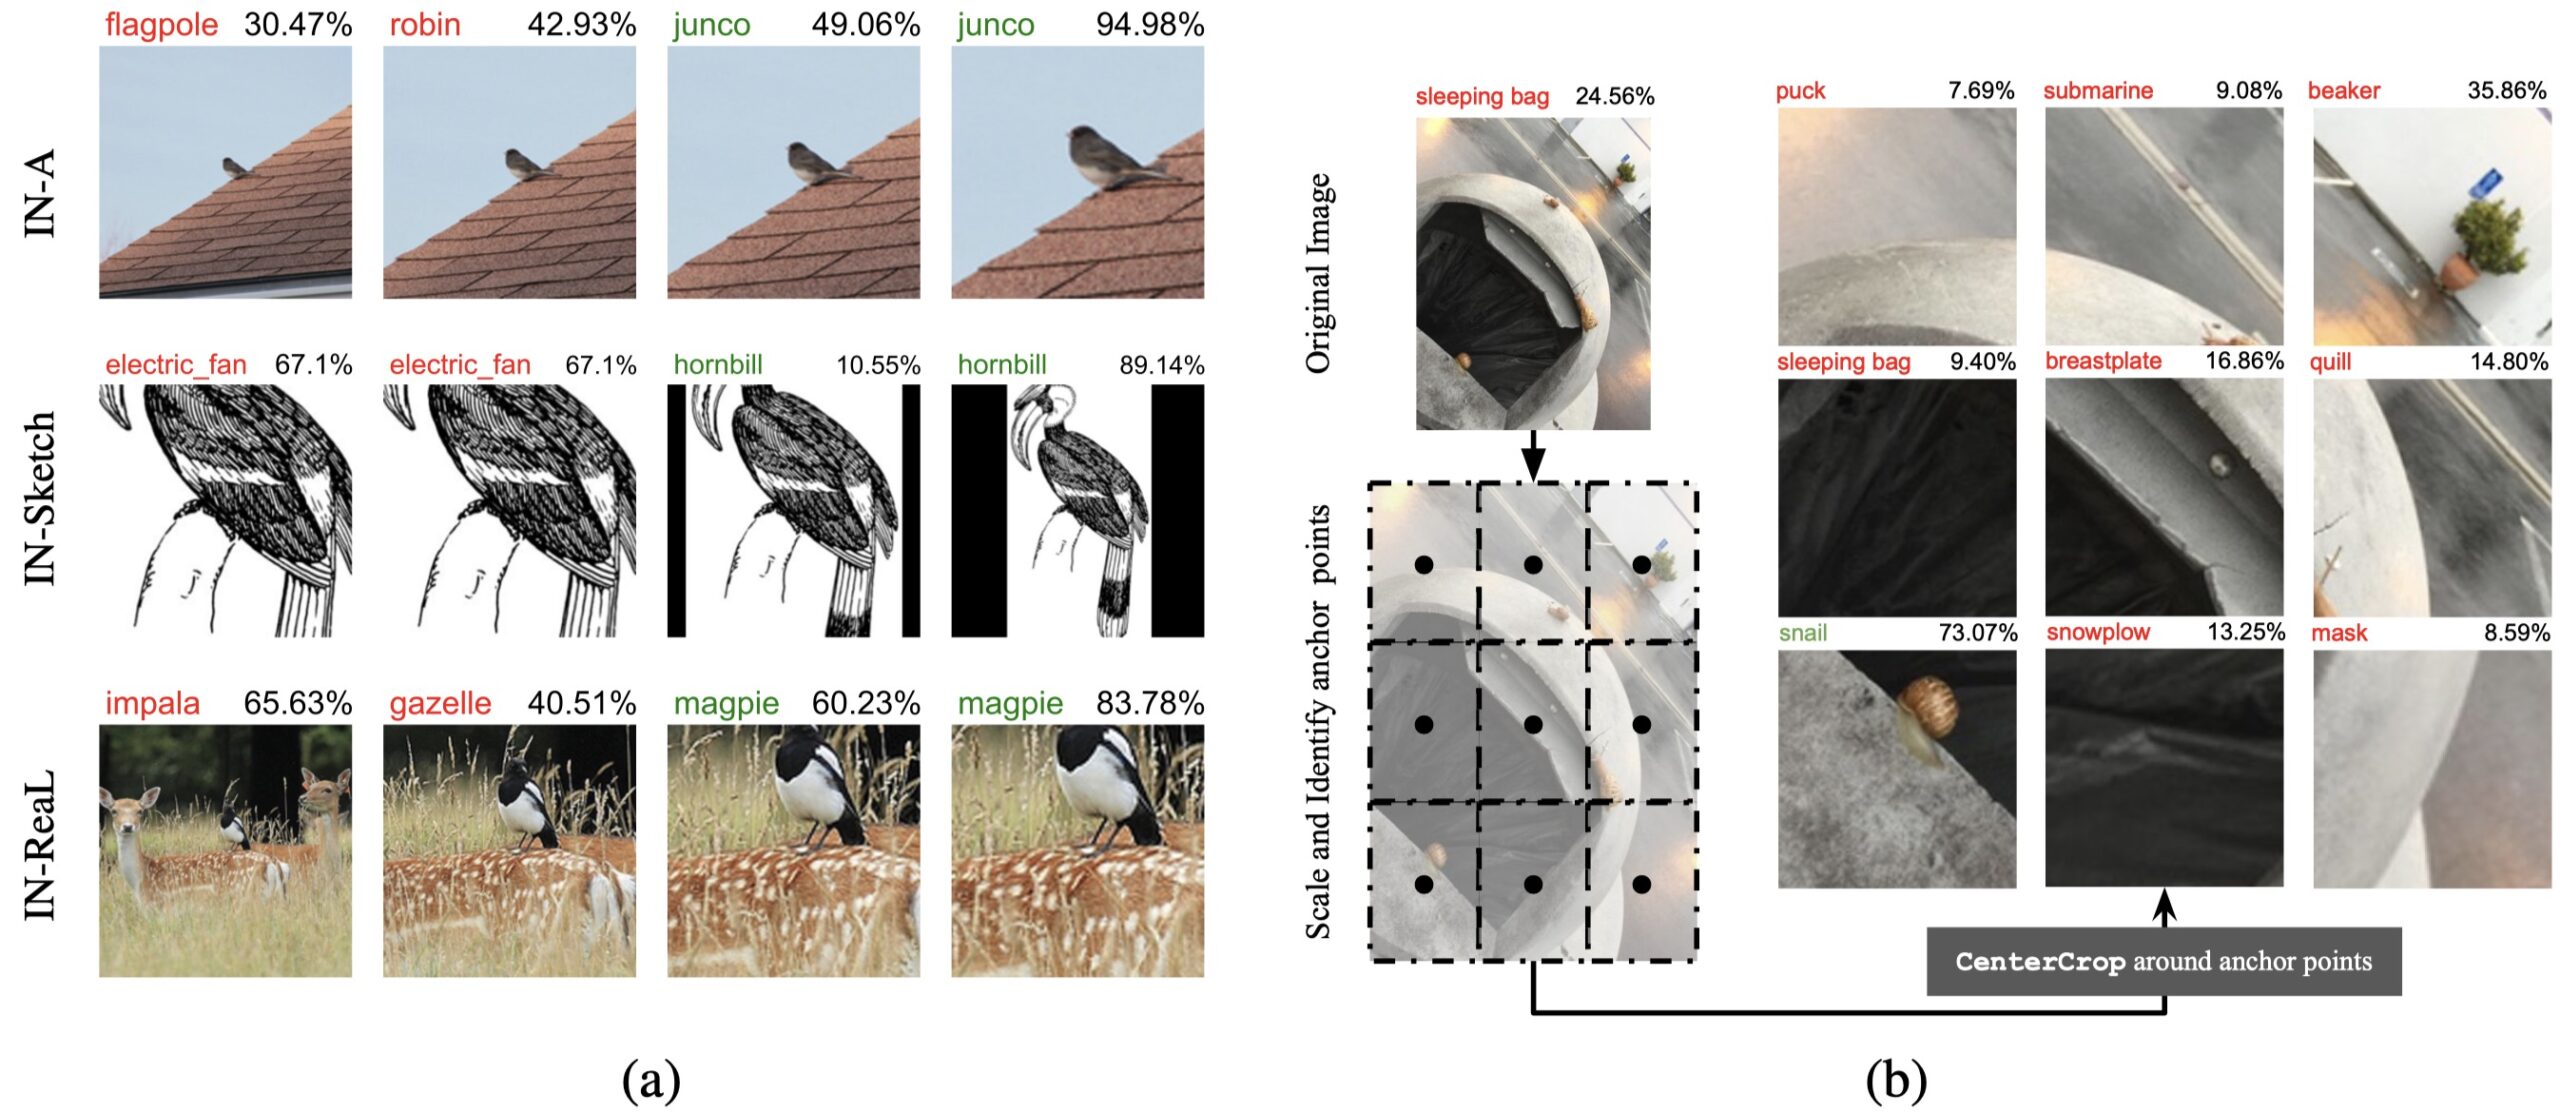
Figure 1: (a) Each subfigure shows an input image, predicted label, and confidence score from an ImageNet classifier (top and middle: ResNet-50 [23]; bottom: ViT-B/32 [17]). With the standard center-crop transform, all 3 samples were misclassified (left-most column). Adjusting framing via zooming yields correct predictions. (b) The zooming process correctly classifies a snail ImageNet-A image. We uniformly adjust the input query image’s smaller dimension to match the target scale S. We then partition the image into a 3 × 3 grid, generating 9 crops centered at grid-cell centers (i.e., • anchor points) and feed each crop to the original image classifier.
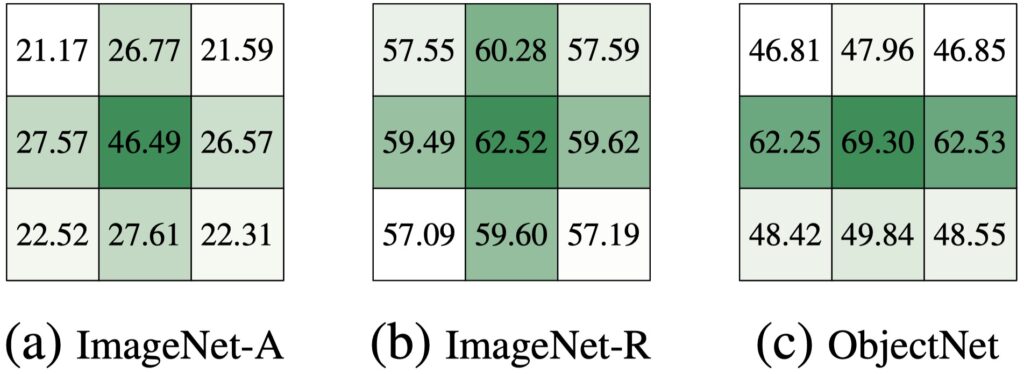
Figure 2: Upper-bound accuracy (%) of ResNet-50 at each of the 9 zoom locations. The large gaps between the center and eight off-center locations on IN-A and ON demonstrate a center bias, which is much smaller in IN (Appendix B.2) and IN-R (b).
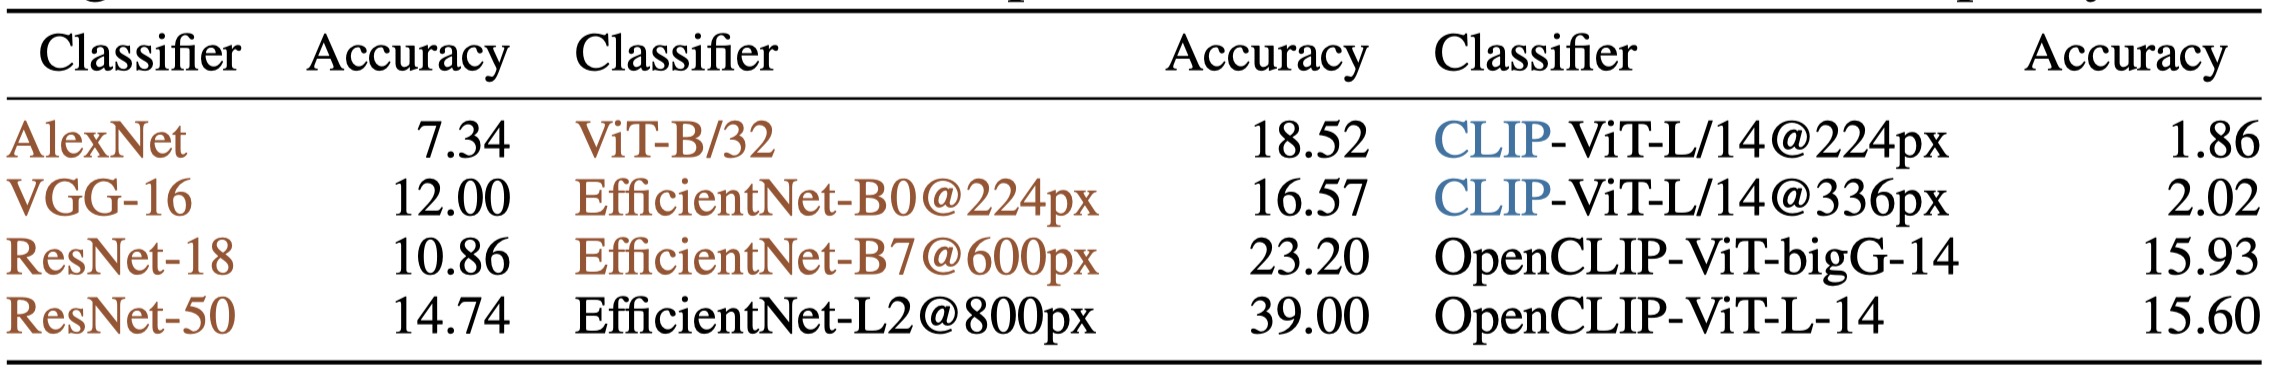
Table 1: Top-1 accuracy (%) on ImageNet-Hard of IN-trained models and those trained on larger, non-ImageNet datasets (black). All models operate at 224×224 unless otherwise specify.
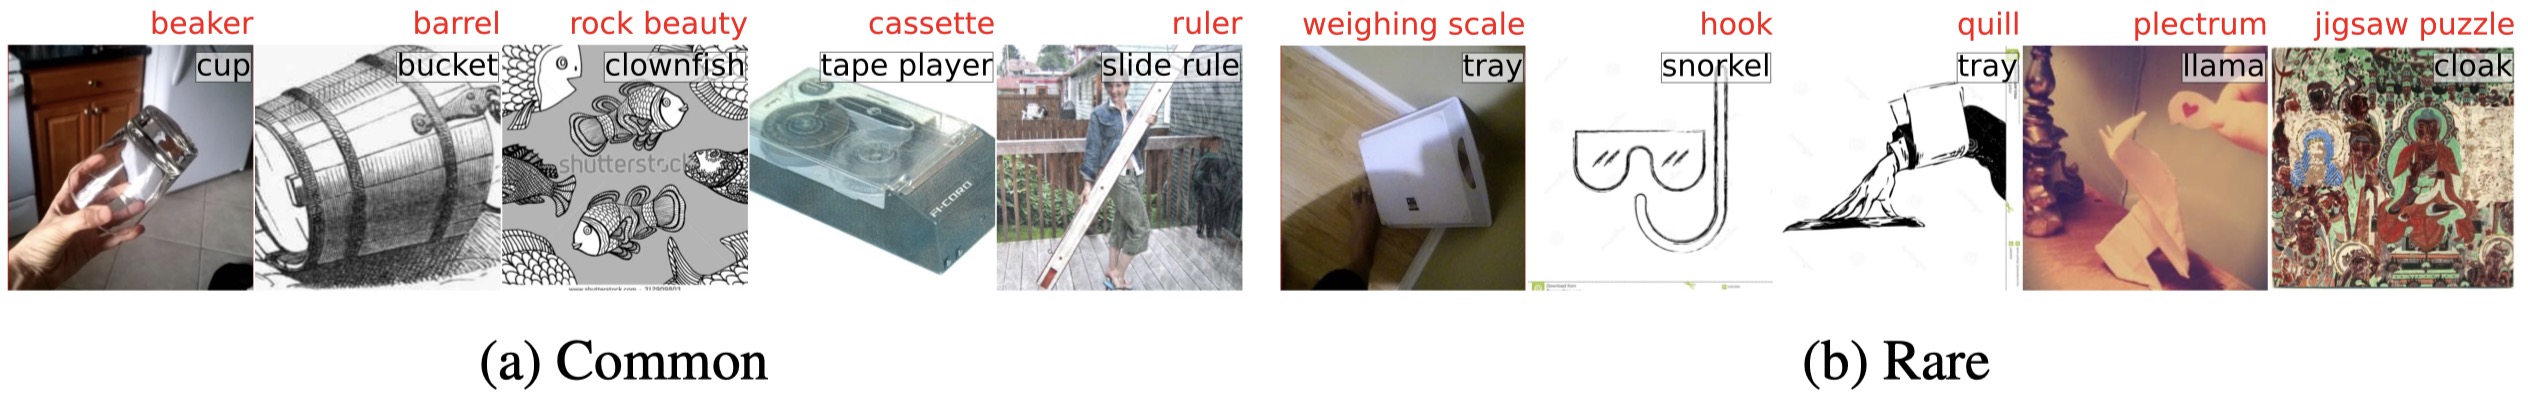
Figure 3: ImageNet-Hard samples misclassified by EfficientNet-L2@800px can be categorized into two groups: (a) Common: the top-1 label is related to the groundtruth label; and (b) Rare: the top-1 label is semantically far from the groundtruth label.


